How likely is a super
El Niño this winter?
Updated each Monday from the major ENSO outlooks (NOAA CPC, IRI, BoM) and a multi-model forecast consensus (ECMWF SEAS5 with the NMME suite), plus weekly Niño 3.4 observations. Peak season target: DJF 2026-27. Forecast disagreements are surfaced rather than averaged.
Probabilities use the v1.8 consensus estimator: a CPC-derived anchor (live offset +0.60°C, week of 2026-06-17, skew-normal fit on the strength table) deflected toward an equal-weight multi-model consensus (ECMWF SEAS5 plus the NMME suite), consensus-led at weight 0.85. The +3.0°C bucket is different in kind: it sits beyond every event in the instrumental record, so it carries almost no historical anchor and is driven mostly by direct model member counts above +3.0. Treat it as the brief's least-certain figure, a directional read on tail risk rather than a calibrated probability. Deltas compare to the issue four weeks prior, aligned with CPC's monthly cadence; in the brief's first month the comparison falls back to the launch issue, and weeks crossing a methodology-version change show no delta. Full estimator math on the methodology page.
What's interesting this week
Observations from this week's data, beyond what the headline numbers say.
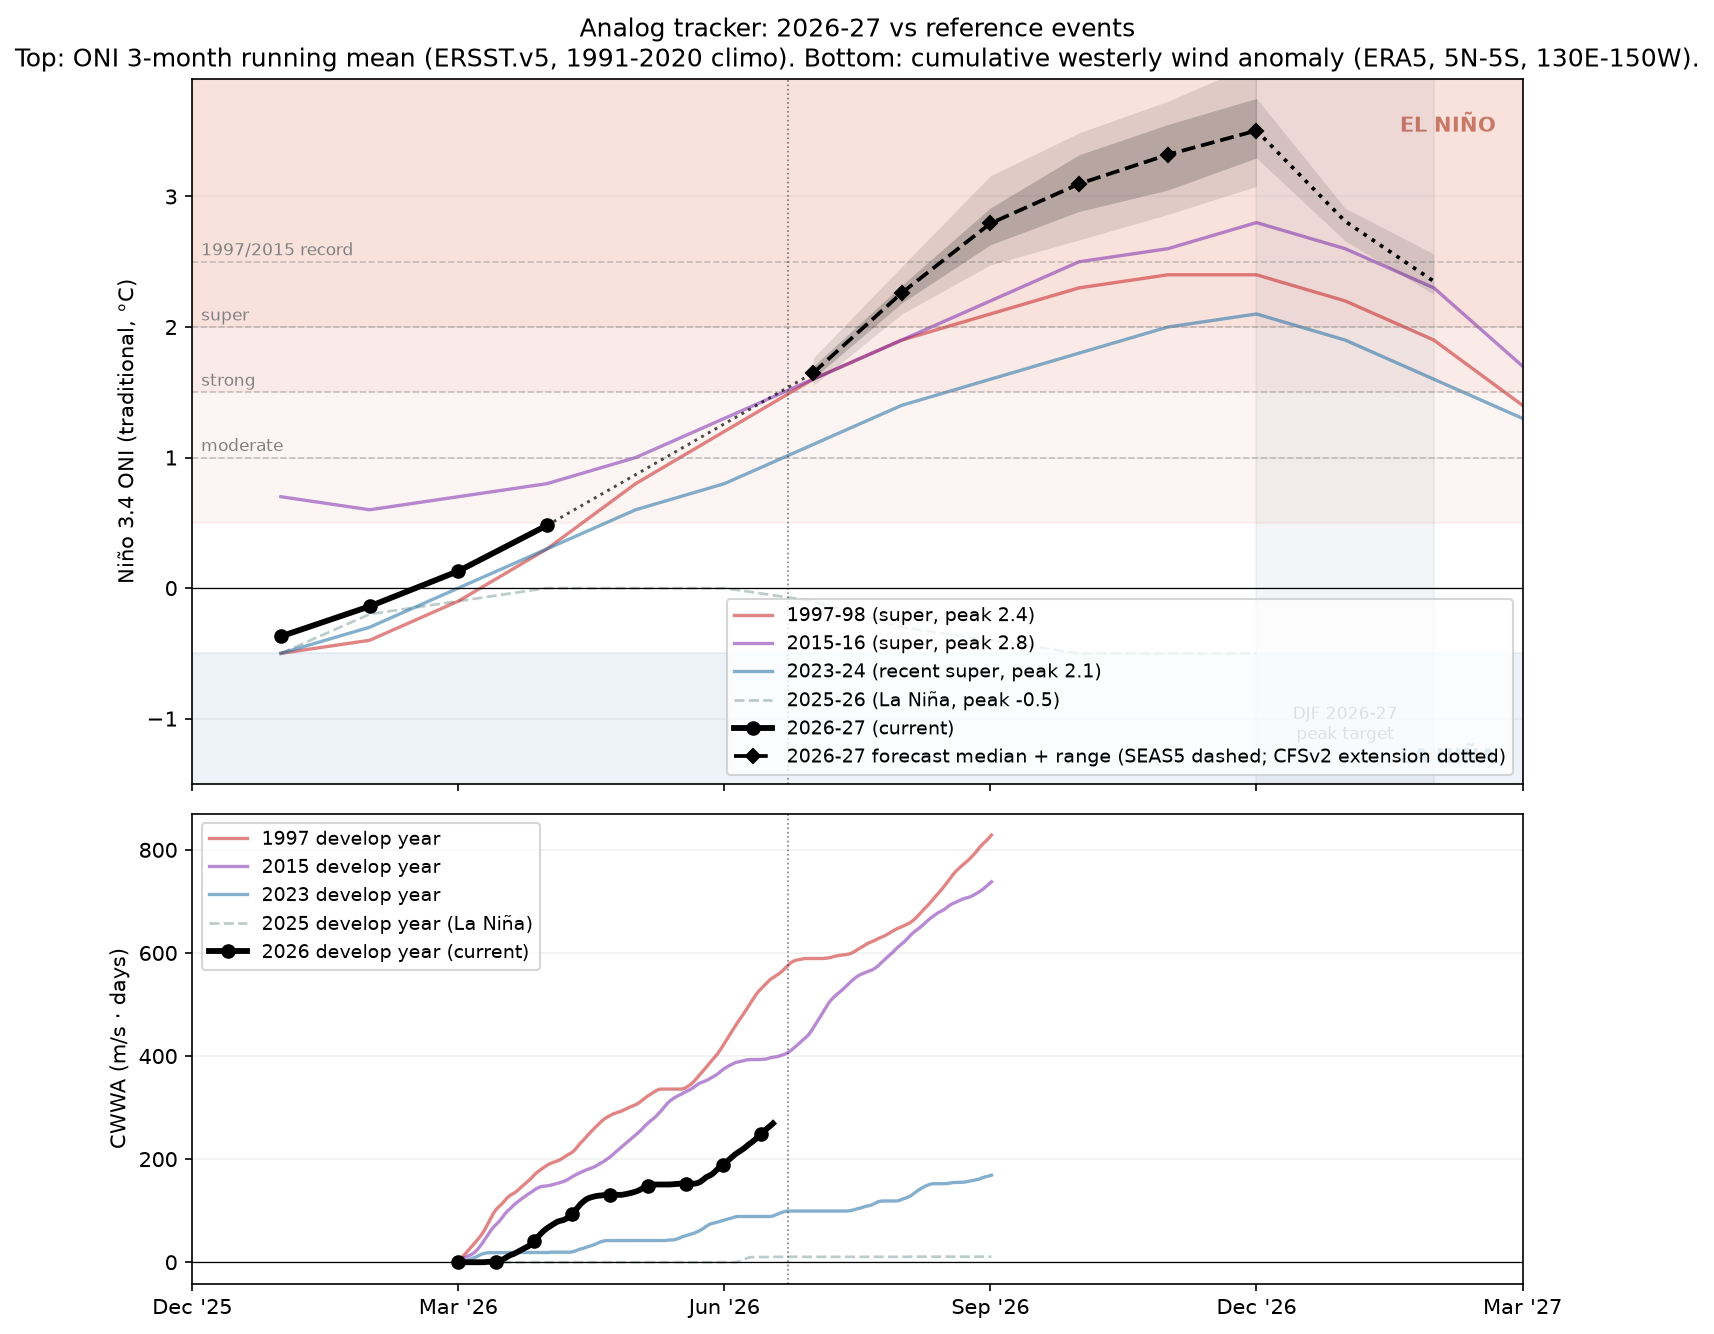
- Subsurface heat ahead of both Godzilla analogs. 0–300 m heat content anomaly is now +1.99°C, vs +0.7°C in 1997 and +1.6°C in 2015 at the same calendar week, running ahead of either super-event analog at this stage of development.
- Strongest WWB already in super-event territory. 2026's strongest westerly wind burst peaks at 23.9 m/s on 2026-04-12, vs full-season peaks of 27.7 (1997) and 29.5 (2015). Peak amplitude is super-event-aligned even though cumulative wind energy is lagging.
Analog tracker
2026-27 trajectory vs reference El Niño events, plus a combined SEAS5 and CFSv2 forecast carried through the winter peak.
Physical state
Current observations vs the same calendar week in past super-event develop years.
| Indicator | Current week of 2026-06-22 | 1997 same week | 2015 same week |
|---|---|---|---|
| Niño 3.4 weekly (traditional) | +1.7°C | −0.1°C | +0.6°C |
| Niño 3.4 weekly (RONI) | +1.1°C | n/a (pre-RONI) | n/a (pre-RONI) |
| 0–300 m heat content anomaly | +1.99°C | +0.7°C | +1.6°C |
| Cumulative westerly wind anomaly since Mar 1 CWWA, ERA5 5°N–5°S, 130°E–150°W, m/s·days | 269 | 552 | 398 |
Impact outlook
Aggregation of institutional impact ranges for the developing event. Probabilities below are from named external sources, conditional on the headline strong-to-super case in section 1 materializing.

Mediterranean
Spain, Portugal, Italy, Greece, southern France. Probability of severe summer 2026 heat and drought: high, >70% Iberia, ~65% Italy/Greece/southern France. The 2024 July Mediterranean heatwave was characterized by World Weather Attribution as "virtually impossible without human-caused climate change". A 2003-magnitude European heat event (~70,000 excess deaths) is rated medium probability (~25-30%) on a strong El Niño compounded with the multi-year Mediterranean drought baseline.
Amazon basin
Probability of major drought 2026: high (>70%); probability of fire season exceeding 2024 hotspot levels: medium-high (~50%). NASA SERVIR characterized the 2023-24 drought magnitude as "roughly double" the 2015-16 event. The 2024 fire season produced a 76% increase in hotspots vs 2023.
Australia and the Great Barrier Reef
Probability of severe bushfire season austral summer 2026-27: high (>65%); GBR mass bleaching: very high (>85%); agricultural drought: high (>70%). The reef has bleached six times since 2016; another super event makes a sixth-in-eight-years bleaching baseline. Australian winter wheat is the cleanest El Niño short on record, with declines of 16% to 46% under prior strong events (1965, 1977, 1982, 1994, 1997, 2023).
Southern Africa
Probability of major drought repeat: ~70% if rains arrive late, per OCHA framing of the 2023-24 baseline ("worst impacts in 40 years"). Probability of a humanitarian appeal exceeding $5 billion: medium-high (~50%). Six SADC countries declared emergency in 2024; back-to-back is the asymmetric humanitarian risk.
India and South Asia
IMD's April 2026 monsoon outlook is 92% of the long-period average, the first below-normal April call since 2015. Of 16 historical El Niño years since 1950, 7 produced below-normal Indian monsoons (IMD MMCFS). Pre-monsoon heat already reached 43.8°C at Akola in mid-April 2026.
United States
California atmospheric river season: above-normal Pacific storm count winter 2026-27 high (~70%), with ~50% probability of a major atmospheric river damage event January-March 2027. Pacific Northwest: warmer-drier winter (~70%) with significant 2026 fire season (~50%). Atlantic hurricane season: high probability (~70%) of below-normal activity from El Niño wind shear, partially offset by warm Atlantic SSTs (2023 produced 20 named storms despite an El Niño base state). Southern Plains drought relief: low-medium (~25-30%); the 2023-24 super event underdelivered there.
Southeast Asia
Significant drought in Indonesia: high (>70%); palm oil production decline: medium-high (~55%). The 2015-16 super event delivered a 13.2% Malaysian palm oil production decline at a 12-month lag. Vietnamese coffee output fell 20% in 2023-24.
Global coral
The 2023-25 fourth global bleaching event already affects ~84% of world reefs (International Coral Reef Initiative, April 2025). Continued mass bleaching across all tropical basins is essentially certain into 2026-27.
Source-by-source check
What each agency said this week, verbatim where useful.
- NOAA CPC strength table, NDJ 2026-27 (RONI)issued 2026-06-11super 63%, strong 25%, moderate 10%, weak El Niño 2%, neutral 0%, La Niña 0%.
- IRI plume, DJF 2026-27issued 2026-05-19El Niño 98%, neutral 2%, La Niña 0%. Strength not broken out in the public Quick Look.
- BoM ENSO Outlookissued 2026-06-16El Niño underway in the tropical Pacific. Categorical only.
- ECMWF SEAS5run 2026-06-0151-member SEAS5 ensemble for 2026-12: median Niño 3.4 anomaly +3.51 deg C; 51/51 members above +1.5 (~100% above +2.0, ~100% above +2.5).
Caveats this issue
- The CPC anchor for the +2.5°C bucket carries a 67–70% range. It comes from a bootstrap that perturbs CPC's published bin probabilities by Gaussian noise (sigma 1 percentage point, matching CPC's whole-percent reporting precision) and refits the skew-normal each time. The range reflects reporting-quantization uncertainty in CPC's table, not underlying forecast uncertainty. The smoothed headline (80%) sits above this anchor range because the bounded SEAS5 deflection (+11.5pp this issue) lifts it.
- ECMWF SEAS5 vs CPC anchor on the upper tail above +2.5°C trad ONI: SEAS5 has 51/51 members (100%) at 2026-12 (max available lead); the CPC anchor lands at 67–70%. The v1.5 smoothing absorbs 20% of this gap (capped at ±10pp/week), moving the smoothed headline to 80%. We subtract SEAS5's own model climatology, which removes its known ENSO warm bias; an observational-climatology subtraction would put SEAS5 higher still. For broader context, multi-model pools (e.g., the Climate Brink dashboard's 13-model 637-member view) currently report a meaningfully higher probability for the same threshold; the gap reflects CPC's analyst-correction vs raw multi-model breadth, documented as methodology limitation #7.
- Spring predictability barrier: April–May forecasts at any of these centers carry materially wider error bars than what we'll see in July–August. Treat all numbers as preliminary.